Invest with intelligence
Hammer:
A hammer is a single candlestick pattern that forms when the open, high, and close prices are roughly the same, with a long lower shadow or tail. The lower shadow should be at least twice the length of the real body of the candlestick.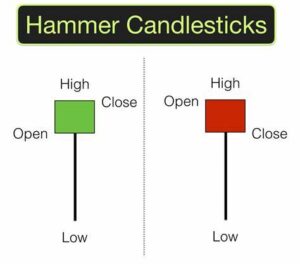 The hammer pattern is considered a bullish reversal pattern, suggesting that the price may reverse from a downward trend. It indicates that even though the bears were in control during the trading session, the bulls managed to push the price back up, creating a long lower shadow. This indicates that the bulls have gained momentum and are now in control, potentially leading to a price increase.
It’s important to note that a hammer should be confirmed by other technical indicators and analysis before making any trading decisions. Additionally, false hammers can also occur, which are also known as hanging man patterns. These patterns look similar to hammers, but they form at the top of an uptrend and can indicate a potential bearish reversal.
The hammer pattern is considered a bullish reversal pattern, suggesting that the price may reverse from a downward trend. It indicates that even though the bears were in control during the trading session, the bulls managed to push the price back up, creating a long lower shadow. This indicates that the bulls have gained momentum and are now in control, potentially leading to a price increase.
It’s important to note that a hammer should be confirmed by other technical indicators and analysis before making any trading decisions. Additionally, false hammers can also occur, which are also known as hanging man patterns. These patterns look similar to hammers, but they form at the top of an uptrend and can indicate a potential bearish reversal.
Doji:
A doji is a single candlestick pattern that occurs when the open and close prices are the same or very close, resulting in a small or no real body. It can appear in various shapes, including long-legged doji, dragonfly doji, and gravestone doji, depending on the position of the shadows.
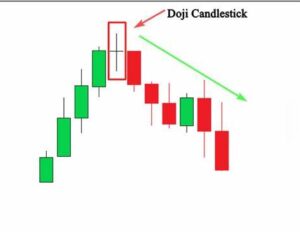 The doji pattern is a neutral pattern that indicates indecision in the market and potential balance between buyers and sellers. It suggests that the price movement during the trading session was relatively equal in both directions, resulting in no net change in price.
While a doji pattern can signal potential market indecision, it’s important to note that it should be confirmed by other technical indicators and analysis before making any trading decisions. Additionally, dojis can also occur as part of larger trend patterns, such as an evening star or morning star, which can indicate potential reversals.
The doji pattern is a neutral pattern that indicates indecision in the market and potential balance between buyers and sellers. It suggests that the price movement during the trading session was relatively equal in both directions, resulting in no net change in price.
While a doji pattern can signal potential market indecision, it’s important to note that it should be confirmed by other technical indicators and analysis before making any trading decisions. Additionally, dojis can also occur as part of larger trend patterns, such as an evening star or morning star, which can indicate potential reversals.
 The engulfing pattern is considered a strong reversal signal as it suggests a significant shift in the market sentiment. It indicates that the buying or selling pressure has become dominant, overpowering the opposite pressure from the previous candle.
It’s important to note that an engulfing pattern should be confirmed by other technical indicators and analysis before making any trading decisions. Additionally, false signals can occur, and traders should be careful to distinguish between real and false signals.
The engulfing pattern is considered a strong reversal signal as it suggests a significant shift in the market sentiment. It indicates that the buying or selling pressure has become dominant, overpowering the opposite pressure from the previous candle.
It’s important to note that an engulfing pattern should be confirmed by other technical indicators and analysis before making any trading decisions. Additionally, false signals can occur, and traders should be careful to distinguish between real and false signals.
The doji pattern is a neutral pattern that indicates indecision in the market and potential balance between buyers and sellers. It suggests that the price movement during the trading session was relatively equal in both directions, resulting in no net change in price.
While a doji pattern can signal potential market indecision, it’s important to note that it should be confirmed by other technical indicators and analysis before making any trading decisions. Additionally, dojis can also occur as part of larger trend patterns, such as an evening star or morning star, which can indicate potential reversals.
Engulfing:
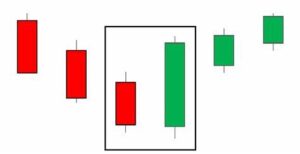
An engulfing pattern is formed by two candlesticks, with the second one completely engulfing the first. A bullish engulfing pattern occurs when a small red candle is followed by a larger green candle, indicating a potential bullish reversal. The green candle should have a larger real body than the red candle and should open below the close of the previous candle and close above the high of the previous candle. On the other hand, a bearish engulfing pattern occurs when a small green candle is followed by a larger red candle, indicating a potential bearish reversal. The red candle should have a larger real body than the green candle and should open above the close of the previous candle and close below the low of the previous candle.
The engulfing pattern is considered a strong reversal signal as it suggests a significant shift in the market sentiment. It indicates that the buying or selling pressure has become dominant, overpowering the opposite pressure from the previous candle.
It’s important to note that an engulfing pattern should be confirmed by other technical indicators and analysis before making any trading decisions. Additionally, false signals can occur, and traders should be careful to distinguish between real and false signals.